
By Matt Fogleson
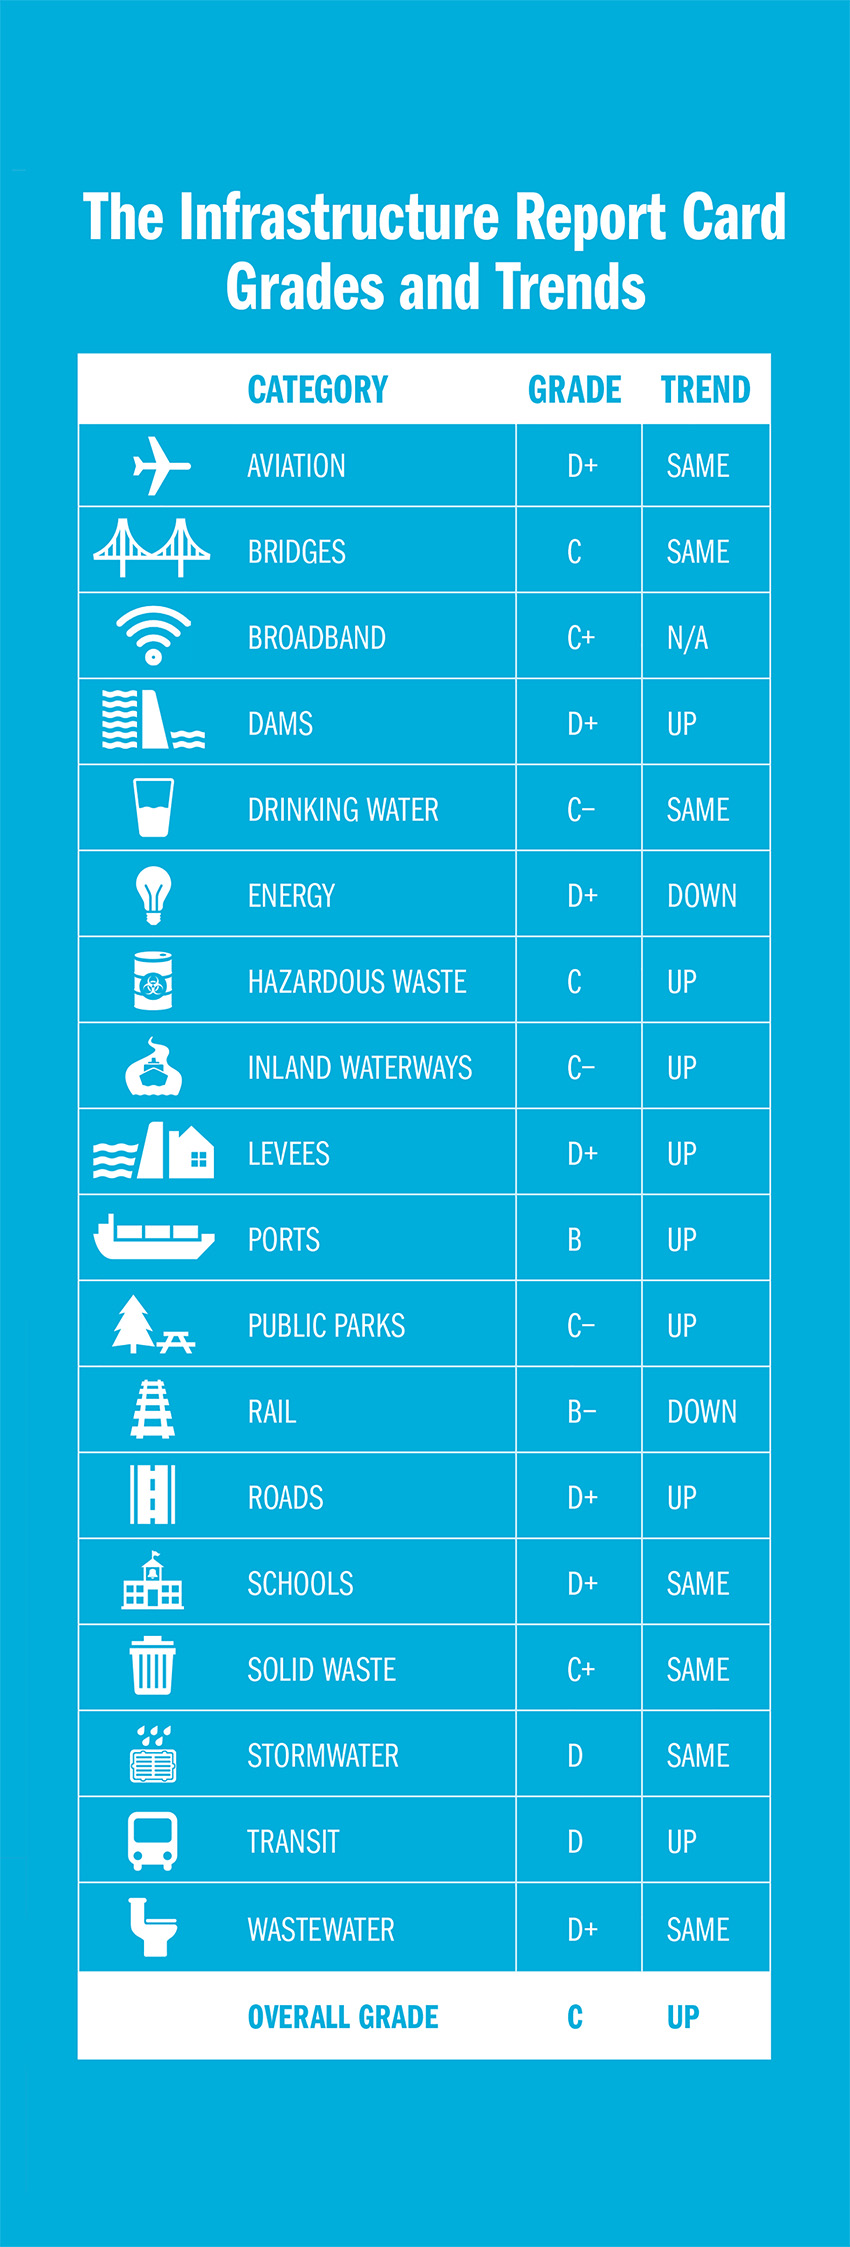
ASCE’s 2025 Report Card for America’s Infrastructure assigned an overall grade of C to the nation’s infrastructure, the best since ASCE began determining grades in 1998 and incrementally better than the C- assigned to its 2021 predecessor. Eight categories saw improved grades, seven stayed the same, and two slipped.
And while there is plenty of room for guarded optimism, there is no time to celebrate. Instead, we must keep the impetus going and the funding coming.
ASCE’s initial 1998 effort saw an overall grade of D, followed by a stretch featuring either a D or D+ in each of the ensuing five evaluations before breaking through with 2021’s C-.
“The trend is in the right direction,” says Darren Olson, P.E., BC.WRE, M.ASCE, the chair of ASCE’s Committee on America’s Infrastructure, which produces the report card. “I think we’ve been very successful since (1998) in working with our elected officials to talk to them about how poor the condition of our country’s infrastructure had gotten after decades of underinvestment and just how important it (is) — whether you talk about the public welfare, our national economy, public safety — to invest in (it).”
Those investments have been significant since the last report card’s release. Chief among them is the Infrastructure Investment and Jobs Act, which was signed into law in November 2021 and authorizes $1.2 trillion for infrastructure spending between 2022 and 2026. With authorization expiring next year, Congress must decide how programs under the legislation will be funded going forward. The Inflation Reduction Act, passed in 2022, was also beneficial to infrastructure investments, providing $369 billion for energy security and environmental programs.
With so much money going toward our infrastructure, it may be natural to wonder why the grades are not even better. The answer: These things take continued effort and sustained funding.
Olson preaches patience.
“It takes a while to get these projects from a planning stage or even an engineering stage to actually constructed, where their impacts are being felt by the public,” says Olson, who is a vice president and head of the water resources department at Christopher B. Burke Engineering Ltd. in Rosemont, Illinois.
“I think we’ve set ourselves up fairly well to hopefully continue this trajectory upward with this funding that we’ve received. But there just simply weren’t enough projects that have been constructed and not enough metrics out there on projects that had been constructed to justify raising the grades in a lot of the categories,” Olson explains.
Many big projects that resulted from this government funding should be complete in time to impact grades on the next report card in 2029.
Maria C. Lehman, P.E., ENV SP, NAC, F.ASCE, describes America’s infrastructure as being “not in a midlife crisis but an old-age crisis; everything is coming due at the same time.” Among the larger projects across the country that are benefiting from the surge of federal funding are the overhauling of the Brent Spence Bridge, which connects Cincinnati and Covington, Kentucky, and the New York-to-New Jersey Gateway tunnel, which Lehman calls “the lifeblood of commerce for New England, New York, and the mid-Atlantic.”
“The IIJA put the funding pieces in place to get those designs and construction underway,” says Lehman, who was ASCE president in 2023 and served as vice chair of President Joe Biden’s National Infrastructure Advisory Council. “There are hundreds of like examples across the country.”
The funds started flowing about three years ago, which, Olson emphasizes, is not a lot of time in the world of infrastructure.
“These big, significant infrastructure projects can take that long to construct if plans and permits are ready to go the second that money comes out,” Olson says. “It’s a longer process for a project that maybe wasn’t complete with design and permitting. Then it’s going to take even longer for the benefit of projects like that to be felt.
“It will be critical to continue this federal leadership and investment to prevent backsliding when the current funding levels (in the IIJA) expire in 2026.”
Lehman uses a personal example to illustrate the complexities of infrastructure projects. Last year, she and her husband wanted to replace four windows in their western New York home. They got estimates in the spring, hired a contractor, and paid a deposit, with an expected completion time of less than two months. The arrival of the windows was significantly delayed, pushing the job into November as temperatures dipped into the 30s.
“Progress takes time, and infrastructure projects are complex from a funding, planning, procurement, and delivery standpoint,” Lehman says. “In this post-COVID era, supply chain and workforce shortages have made complex problems even more so.
“(For the window project), the budget stayed the same, but the schedule more than doubled. This is an example with one component part: windows. Infrastructure projects have hundreds and sometimes thousands of component parts. Critical paths toward delivery are more complicated than ever, so yes, it takes time.”
A key point of emphasis in the 2025 report card is resilience. As extreme weather events become stronger and more frequent, it is imperative that we build and prepare our infrastructure appropriately. According to the National Oceanic and Atmospheric Association, in 2023, 28 extreme weather events in the U.S. caused nearly 500 deaths and more than $95 billion in damages, and the need for resilient infrastructure has been on full display over the past few months, from the one-two punch of hurricanes Helene and Milton in 2024 to the California wildfires at the start of this year.
A significant addition: Broadband
For the second consecutive report card, a new category joined the fray. In 2021, the new category was stormwater. Now, in 2025, broadband checks in with a respectable C+ in its debut.
It was always an important sector, but it had largely been viewed as a tool for things such as streaming content on television, shopping online, and gaming. The COVID-19 pandemic changed that perception drastically.
“The pandemic really drew into sharp focus how dependent we are on the internet: remote work, distance learning, telemedicine — nearly every part of our everyday lives,” says Ed Barrett, who is president of the broadband unit at HR Green, an engineering and consulting firm, and who served as an adviser for the report card’s broadband chapter. “And all of a sudden, if you didn’t have good connectivity, you didn’t get to participate in those things. It became a huge, visible problem for elected officials.”
Plenty of federal funding has been flowing into the sector over the past few years. The IIJA dedicated $65 billion to broadband, including $42 billion under the Broadband Equity, Access, and Deployment program. Further, the bulk of the Capital Projects Fund’s $10 billion is intended for broadband.
Money for broadband makes an impact faster than it does in other infrastructure areas, which helped the strong initial report card grade. “As we have seen more recent investments in it and it’s pretty quick for those dollars to (actually get) into infrastructure, it did make sense that that grade was going to be higher than the national average,” Olson says.
Barrett, who is based in Austin, Texas, says there were questions about whether broadband would be graded as its own chapter even as the group was working on it. One hurdle, he says, is that while it is part of the national infrastructure, there is not a lot of government-reported data.
“(Nobody is) going out and doing inspections like you do on dams and bridges. There’s no condition reports,” Barrett says. “A lot of the infrastructure is privately owned, so not only are there no official sources, but the private sector, in general, doesn’t like to share their information because it’s competitive. They want to keep it confidential.”
But that is changing. The Broadband Deployment Accuracy and Technological Availability Act, passed in 2020, requires the Federal Communications Commission to improve broadband access maps. While the maps are still hotly debated, Barrett says, the FCC’s new Broadband Fabric dataset has created a much clearer picture and was one factor in the committee’s decision to issue a graded chapter on broadband.
The report card notes that 94% of American households can access a broadband network that meets the FCC’s definition of high-speed internet. But 15% of U.S. adults do not have a home broadband connection. Lower-income Americans and those in rural areas are disproportionately affected. Barrett predicts a wide variance when state infrastructure report cards begin including broadband, with largely urban states greatly outperforming those that are mostly rural.
He was excited when the committee decided to include the sector. “The report card really helps to shine a spotlight,” Barrett says. “I think legislators, particularly from a policy perspective, pay attention to the report card. ... The letter grade has the ability to clarify a lot of data into a single data point that’s easy to understand.”
An important tool
In that regard, broadband is a microcosm of the larger report card. Echoing Barrett’s view, Olson, who was also vice chair of the committee that prepared the 2021 report card, views the effort as a worthy endeavor. “The report card really is a tool that we are able to use to talk to elected officials, to talk to the general public about the state of our infrastructure,” Olson says.
“Most of the general public doesn’t really realize how important infrastructure is in their lives. And I view the report card as a way to reinforce that to people, just how important infrastructure is, how much effort and need there (are) to continue to fund what goes into maintaining and improving our infrastructure.”
The origins of the report card date to 1988, when “Fragile Foundations,” a report by the government-appointed National Council on Public Works Improvement, assessed America’s infrastructure. A decade later, after the government said it would not update the report, ASCE stepped in and created the Report Card for America’s Infrastructure. The first two report cards were published in 1998 and 2001, and since then, they have been released every four years.
The graded sectors that improved in the 2025 report card were dams (D to D+), hazardous waste (D+ to C), inland waterways (D+ to C-), levees (D to D+), ports (B- to B), public parks (D+ to C-), roads (D to D+), and transit (D- to D).
The B grade for ports was the highest of any sector in the report card. The grade for ports has improved in every report card since the sector debuted in the 2013 report card with a C.
Ports were lauded in the 2025 report card for being nimble amid pandemic-induced disruptions. Innovative leaders who are making efforts to cut carbon emissions also helped boost the grade, as did reusing dredged material and automation.
Hazardous waste was the biggest riser among all sectors. The sector’s chapter in the report card cites improved remediation technology and more effective site characterization and cleanup strategies. The sector faces big challenges in dealing with perfluoroalkyl and polyfluoroalkyl substances as well as Superfund and brownfield sites.
Energy and rail were the two sectors that dipped in the latest report card.
Energy fell from a C- to a D+. The sector faces big challenges as the U.S. turns more toward electrification in daily life, with demand experiencing its highest growth in two decades, largely attributable to the ascendency of electric vehicles, data centers, and artificial intelligence.
The report card’s energy chapter notes that aging assets need to be replaced or modernized. The growing frequency of extreme weather events means energy operators must use materials and techniques that counter the threats.
Though rail fell from a B to a B-, that grade is still second-best among the 18 sectors. Amtrak saw a 30% spike in ridership from 2022 to 2023, going from 22 million passengers to 28.6 million, according to the company. Freight rail, meanwhile, supports movement of 1.6 billion tons of goods per year and has a relatively low carbon footprint.
While rail accidents are down by 23% from 2000 to 2023, they have trended slightly upward since 2020, including the highly publicized 2023 derailment in East Palestine, Ohio. Still, rail is reliable and safe overall, the report card concludes. Extreme weather is a hurdle the industry must contend with, and planners are emphasizing resilience in future projects.
Similar to broadband, there are other categories that were difficult to grade because of unreliable or unavailable data. Besides levees and public parks, these include schools (D+) and stormwater (D, a repeat of its debut grade in 2021).
In addition to stormwater, the categories whose grades remained the same for 2025 were aviation (D+), bridges (C), drinking water (C-), schools (D+), solid waste (C+), and wastewater (D+).
'Plan and prevent'
Staying ahead of the curve is critical, and the report card aims to help make that happen.
“A modern economy cannot survive on a crumbling infrastructure,” Lehman says. “As we make these important investments, we will drive costs down for individual households all the way to big corporations while improving economic productivity. My saying on this is to plan and prevent, not repair and repent.”
While Olson and the rest of the committee were happy to see the overall grade rise for the second consecutive cycle, everyone realizes that the race is not nearly complete. Nine of the 18 graded sectors received either a D or D+, raising the question: Why is there still so much work to do?

Decades of underfunding have taken their toll, and it is critical not to lapse back to that mode, which would risk a reversal of the upward trend in grades and, more importantly, make Americans less safe.
To maintain the upward momentum, the committee recommends sustaining investment, emphasizing resilience, and advancing policy and innovation. And the climb will be bolstered by the report card itself. The perception and reception of the report card are vastly different than when ASCE issued the first one 27 years ago. It has become an important component of the progress of infrastructure in the U.S.
“In the last report card, more than 60% of our individual recommendations were incorporated into one of the infrastructure laws passed in the last three years,” Lehman says. “So our voice is getting louder and stronger. We aren’t beating the bushes to find people to talk to us; they now call us. The equation has changed.”
Matt Fogleson is the managing editor for Civil Engineering Source.
This article first appeared in the March/April 2025 issue of Civil Engineering as “Upward Momentum.”
Learn more
Release event: infrastructurereportcard.org/2025-release-event
See the full report: infrastructurereportcard.org
More coverage: Reaction, analysis, and history at source.asce.org